library(palmerpenguins)
penguinsAuthoring with Code
GitHub Copilot
RStudio has a built-in connection to GitHub’s Copilot. Go to Tools > Global Options > Code > Copilot to enable it.
Data Frames
A great way to display data frames is by using df-print: paged in the YAML.
---
title: "Document"
format:
   html:
     df-print: paged
---
For more details, see the Quarto documentation.
Here’s an example with the Palmer Penguins dataset:
For more advanced tables, including search and filtering, see the DT (DataTables) package. Here’s an example using the datatable() function from the DT package to create an interactive table with filtering options:
library(DT)
datatable(penguins,
          filter = 'top')
Code output locations
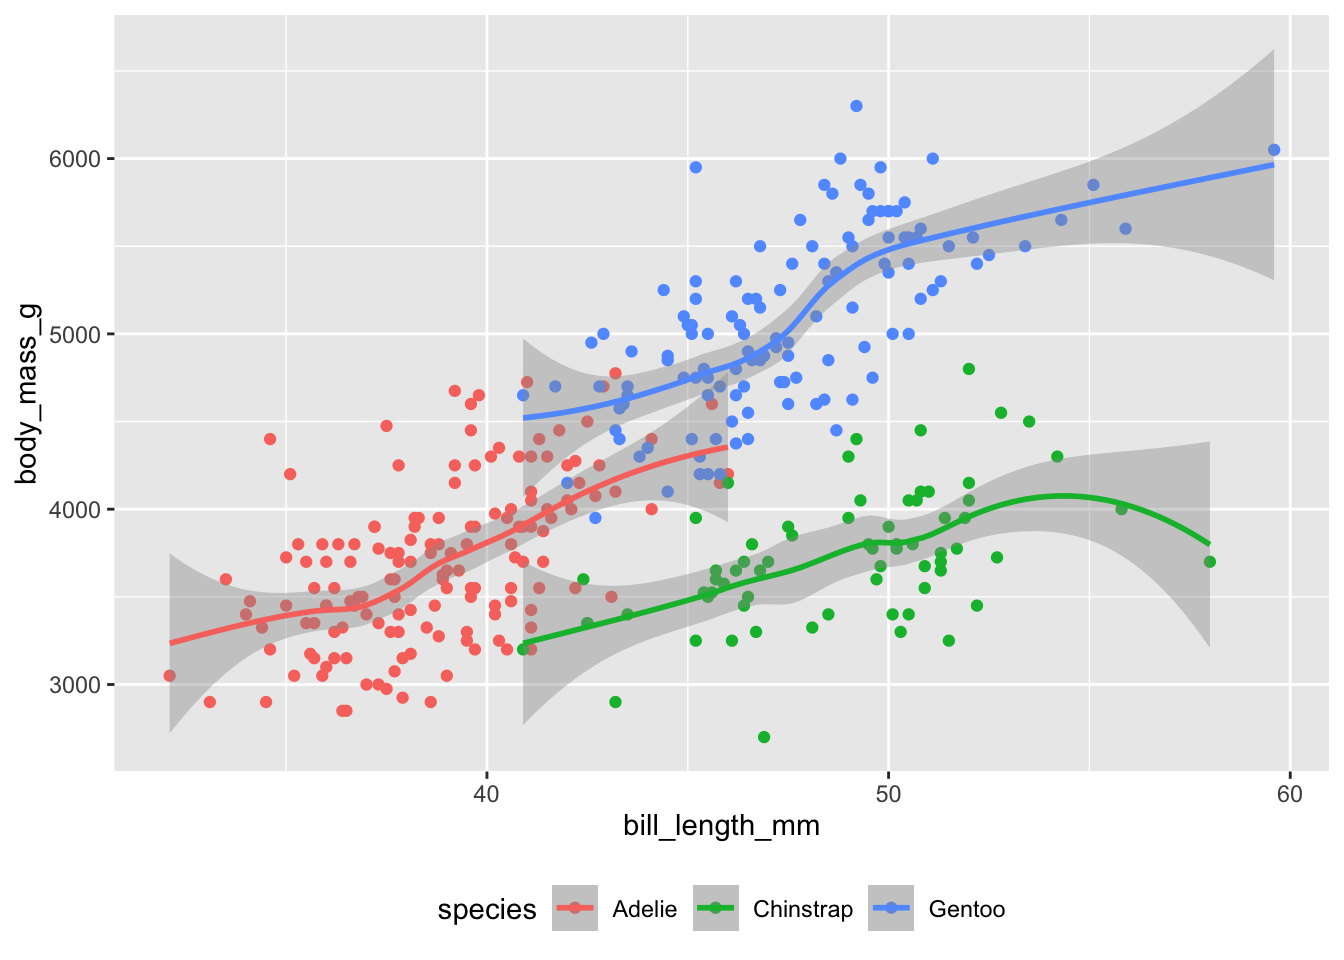
A very useful feature of Quarto is the ability to control where code output appears. This can be used to create a variety of different layouts and formats. A particularly useful option is to place figures in the margin, which can be done using the column: margin option in the code chunk.
```{r}
#| label: fig-penguins
#| fig-cap: "Penguin bill length vs. body mass"
#| column: margin

library(ggplot2)
ggplot(penguins, aes(x = bill_length_mm, y = body_mass_g, color = species)) +
  geom_point() +
  geom_smooth() +
  theme(legend.position = 'bottom')
```
For more details, see Margin Content in the Quarto documentation.
Lightbox figures
Figures in the margins might be difficult to read, but you can use the lightbox: auto option in the YAML to make them clickable and viewable in a larger format. Click on the figure in the margin to see this in action.
---
lightbox: auto
---
See the Lightbox Figures section of the Quarto documentation for more details.
Code Annotation
- 1
- Take penguins, and then…
- 2
- …add new columns for the bill ratio and bill area, and finally…
- 3
- …select only the species, island, bill ratio, and bill area columns.
See Code Annotation for more details.