Who are you?
For those that must be different…
Regardless of reason…
…why you're here, this session will:
- Introduce you to data science
- Introduce you to R
- Discuss some state-of-the-art tools for data exploration and visualization, with the context of classroom use
Open, Interactive Presentation
- Go to https://qubeshub.org
- Navigate to your Dashboard

- Go to My Tools -> All Tools
- Heart Jupyter Notebooks, RStudio, and Serenity
- Launch RStudio
- Click on New Project -> Version Control -> Git
- Enter in https://github.com/mdlama/qbio17
Vision for a data science course
(based on talk by Mine Çetinkaya-Rindel at useR2017)
- modern
- put data front and center
- quantitative (but not mathematical)
- different than high school stats
- challenging (but not intimidating)

Vision for a data science course
Emphasize modern, multivariate exploratory data analysis and data visualization
Vision for a data science course
Teach the data life cycle

Important missing piece: Where does the data come from? (e.g. Experimental Design)
Vision for a data science course
Teach (not just expect) reproducible computation

Vision for a data science course
Approach statistics from a model based perspective

Vision for a data science course
Pedagogical recommendations
- Encourage and enforce working collaboritavely (think, code, write, present)
- Underscore effective communication of findings
- Ask questions students want to answer
- Equip students with the tools to answer questions of their own choosing
What is data science anyways?
This is the difference between statistics and data science, by Justin Megahan
"And there is certainly no lack of demand for data scientists. A few months ago, Glassdoor named it the top job of 2016 – with more than 1,700 job openings and an average salary of $116k."
- Justin Megahan
"There have been calls to do more in the statistics community, to expand its boundaries, to look more to data collection, management, and presentation, to focus more on predicting future outcomes and less on merely inferring relationships."
- Justin Megahan
What is data science anyways?
Data science "is"
- Applied statistics (statistical modeling)
- Data skills (exploratory data analysis and visualization)
- Computational skills (scripting; reproducibility)
Data science is everywhere
New York Times

Data science is everywhere
Wall Street Journal

Data viz for journalists

For educational use?
Sleep Cycle alarm clock

- Students measured sleep over one month, recorded factors of interest (test next day, spring break, sleep location, etc.), and analyzed against sleep quality.
Business


![]()
What about for biology?

Why scripting languages over GUIs?
Reproducibility, Collaboration, Open Source and Versioning
Our path to better science in less time using open data science tools (Lowndes et al., 2017)
"Coding is 'as important to modern scientific research as telescopes and test tubes'\(^1\), but it is critical to 'dispel the misconception that these skills are intuitive, obvious, or in any way inherent'\(^2\)".
Open science challenges
Reasons researchers do not publish reproducibly (Borgman, 2007):
- a lack of incentives in terms of citations or promotion
- the effort required to clean data and codes
- the creation of a competitive advantage over other fellows
- intellectual property issues
Where can I learn/practice my skills?

DataCamp is free for every participant during the Summer Workshop!!
DataCamp R curriculum

DataCamp R curriculum
tidyverse

Step 1: Data Wrangling

tidyverse
Importing data
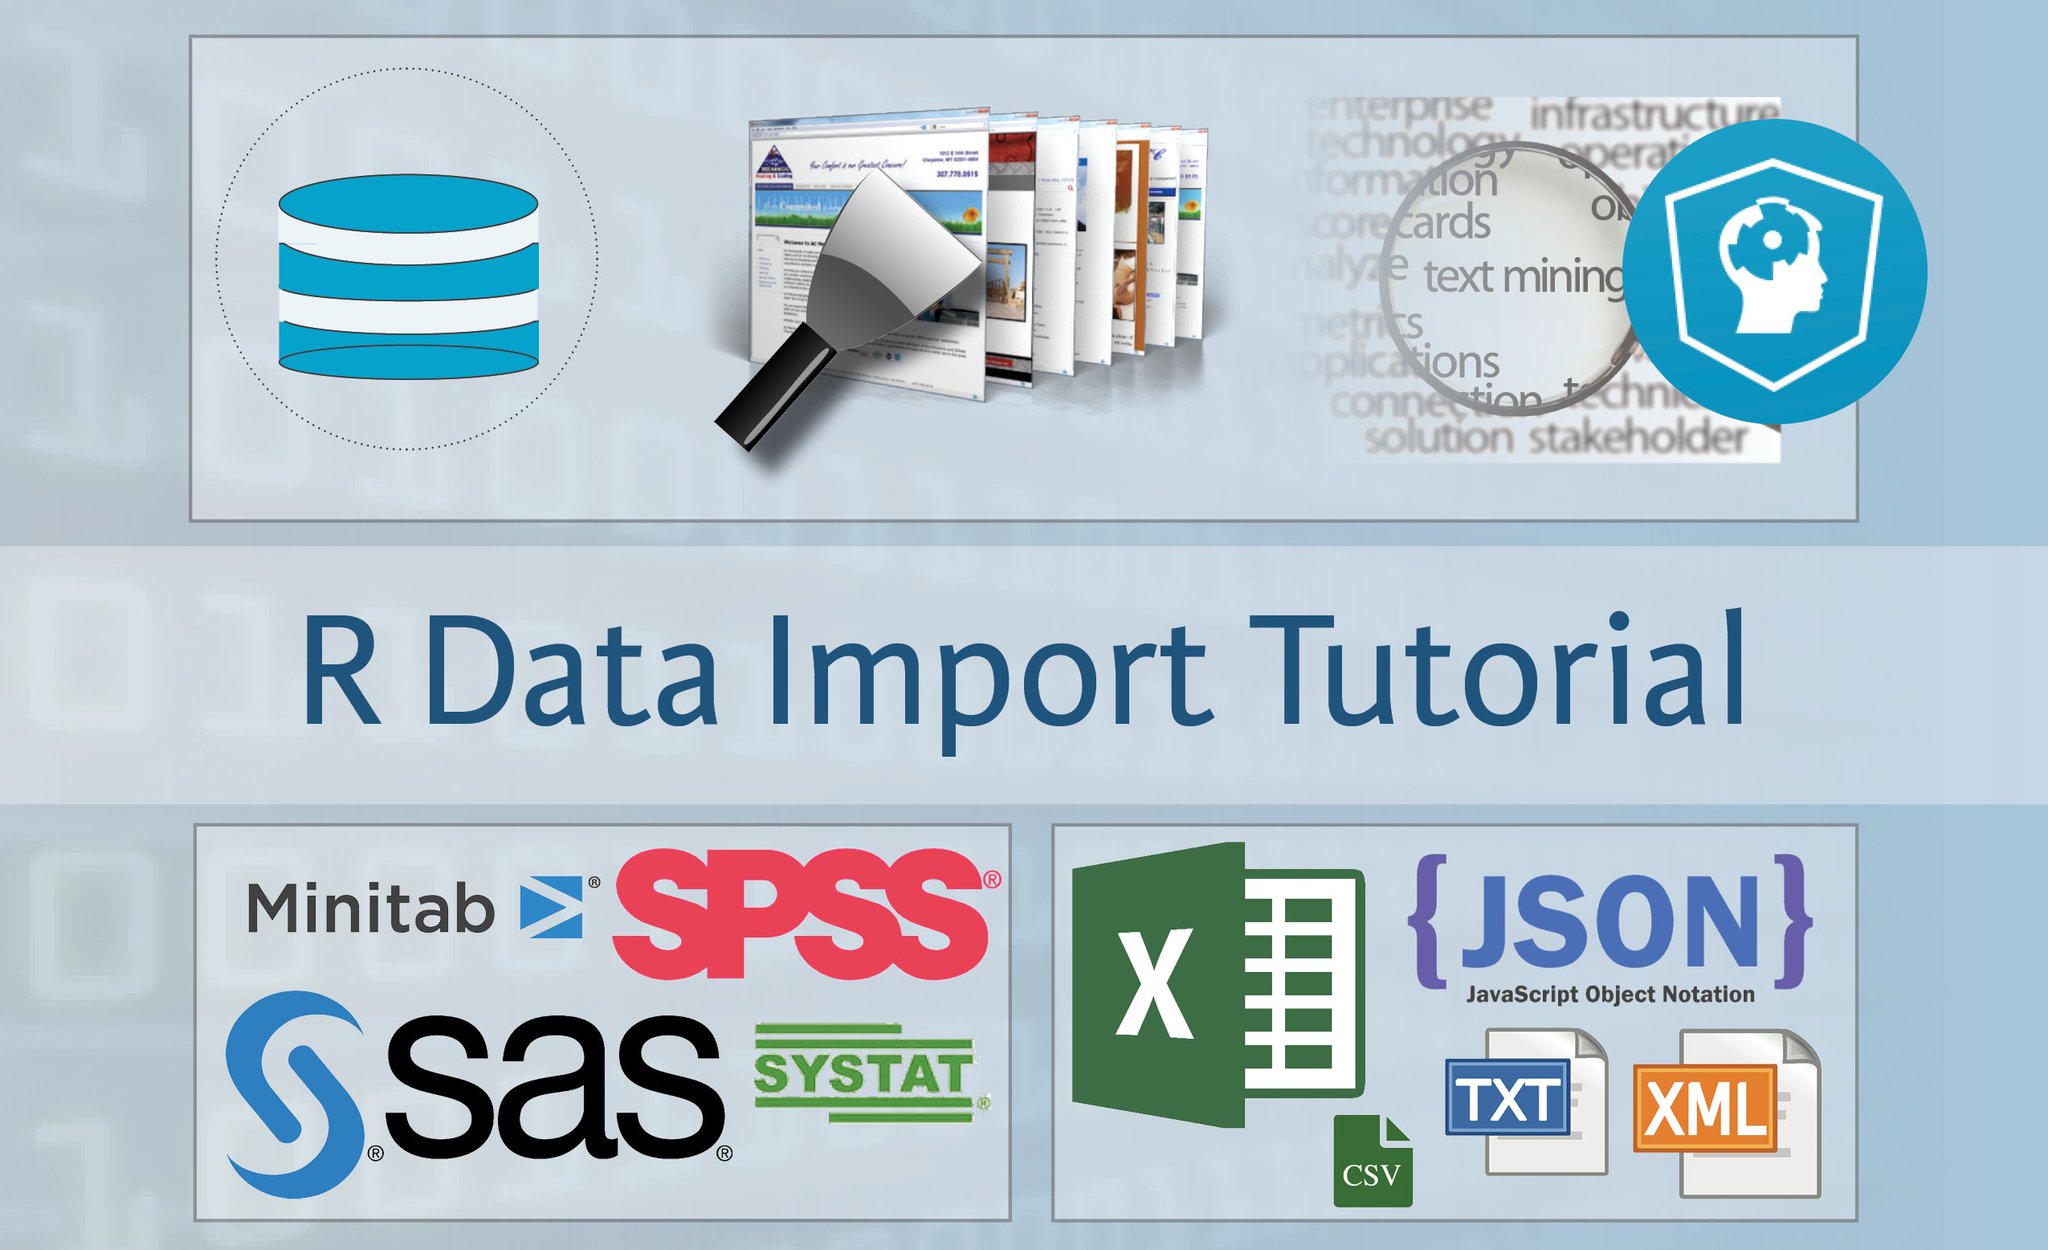
![]()
![]()
![]()
tidyverse
Cleaning data


![]()
tidyverse
Manipulating data

![]()
Step 2: Visualizing data

tidyverse
Visualizing data with ggplot2


The Carpentries

"Our mission is to provide researchers high-quality, domain-specific training covering the full lifecycle of data-driven research."
- Data Carpentry
Data Science in the Classroom
Software on QUBES

Software on QUBES
Jupyter Notebooks
Project Jupyter
JupyterLab (coming soon!)

Project Jupyter
nbgrader (coming "soon" to QUBES!)
Software on QUBES
RStudio Server, R Markdown, and R Notebooks


Software on QUBES
Shiny: Creating GUI web apps in R


Software on QUBES
Interactive Web Documents
![]()

Software on QUBES
Dashboards (Shiny or Flex)

WASTE LANDS - AMERICA’S FORGOTTEN NUCLEAR LEGACY
Software on QUBES
Serenity: Bridging the coding gap

- FOCUSED ON EDUCATION
- Shiny web app
- Focus on data life cycle
- GUI based, like JMP…
- …but creates code from GUI actions for reproducible report
- Default to tidyverse, but allow base R
- Easy drag-and-drop creation of dashboards
- Use pipes user-interface for data life cycle
- Use modern visualization tools (htmlwidgets)
- Database + Google Sheet connections
Software on QUBES
Serenity: Bridging the coding gap
Current version is in development (alpha).
Forked from Radiant developed by Vincent Nijs.

Radiant was developed for teaching Business Analytics.
One more thing…

Wrap-up: References
"'Do experienced programmers use Google frequently?'
The resounding answer is YES, experienced (and good) programmers use Google… a lot. In fact, one might argue they use it more than the beginners."
- Umer Mansoor
Wrap-up: #rstats community rocks!
My whole lab has decided to learn R this summer. We have @hadleywickham books! Any online courses or tutorials you #rstats people recommend?
— Tessa Hill (@Tessa_M_Hill) July 21, 2017
Thank you
Some QUBES communities and resources:
- QUBES Community Group: Using R in the classroom
- Collections in the Using R group
- RStudio Server
- Introduction to Biostatistics (BIOL 327) at William and Mary
- The Analysis of Biological Data by Whitlock & Schluter - QUBES Group
- Serenity: Follow the development!
Remember: DataCamp is free for you this week!